
Dashboard & Reporting
The SaleSpider dashboard provides a comprehensive overview of your store's performance with real-time insights and analytics.
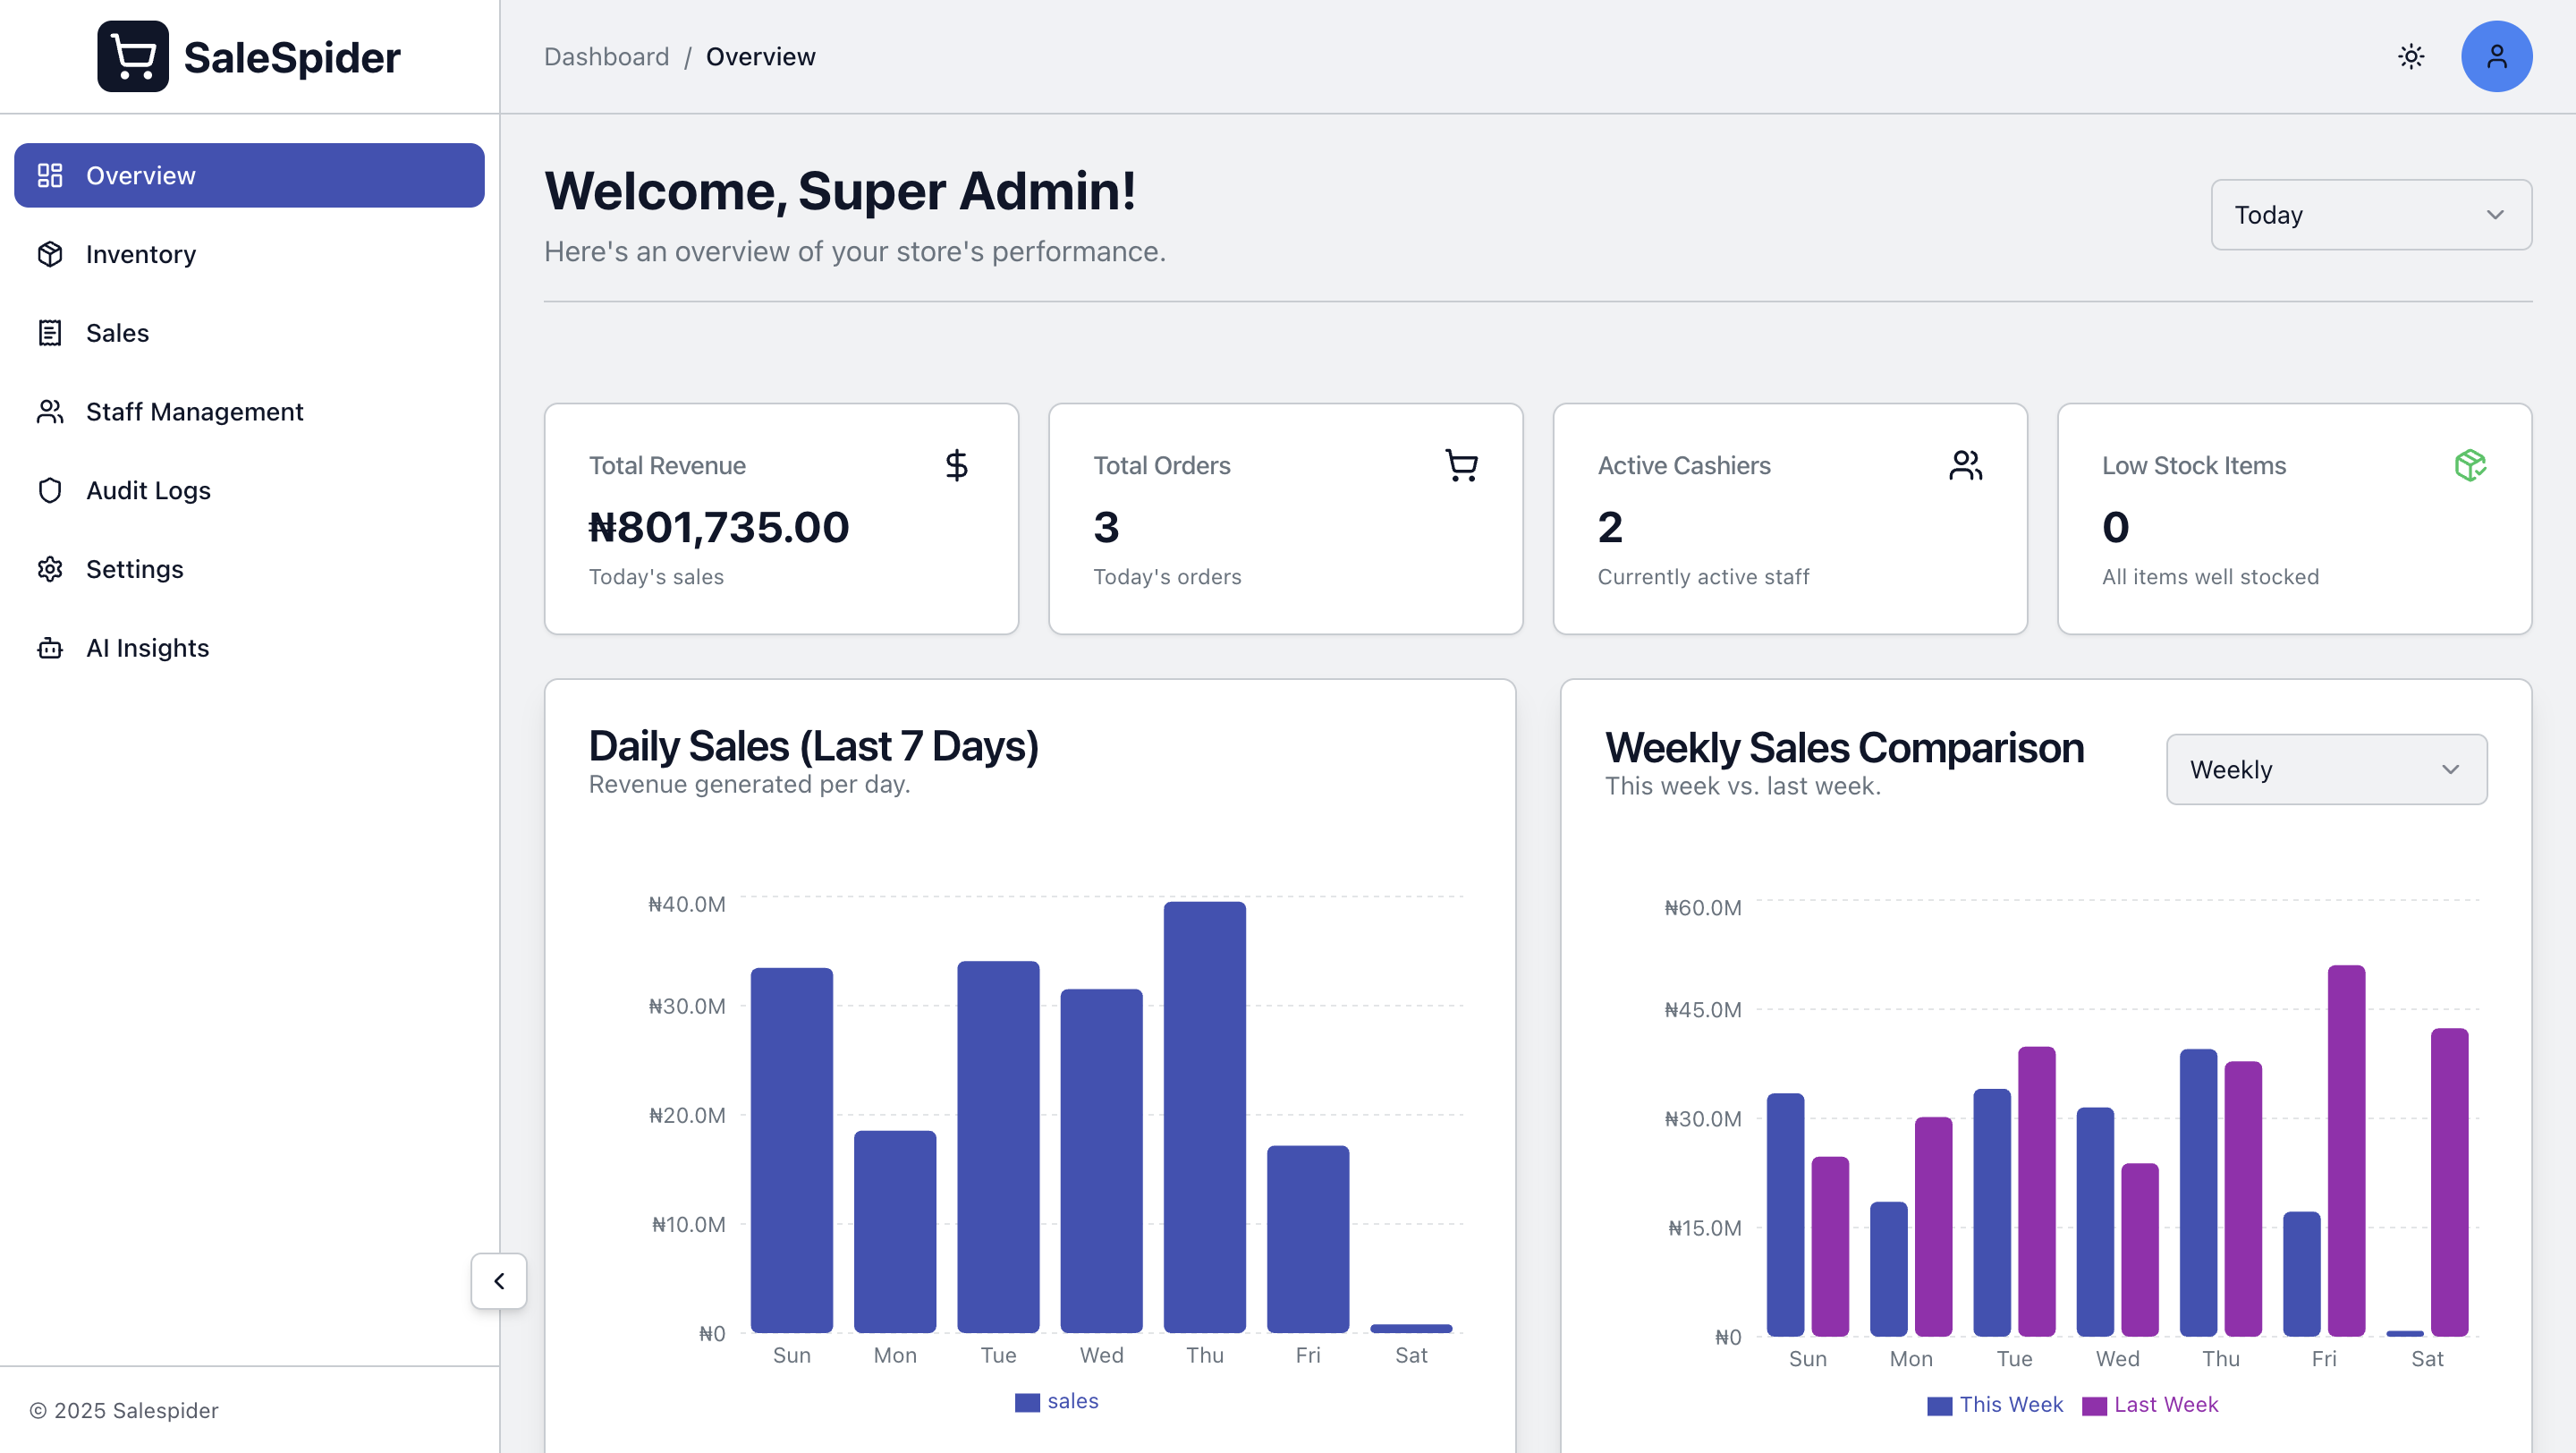
Overview
The dashboard is the central hub of SaleSpider, offering role-based views tailored to different user types:
- Admin Dashboard: Complete system overview with all metrics
- Manager Dashboard: Store performance and staff management
- Cashier Dashboard: Simplified view focused on daily operations
Key Features
Real-Time Metrics
Sales Overview
- Today's sales total
- Sales count
- Average transaction value
- Weekly and monthly totals
Inventory Status
- Total products
- Low stock alerts
- Out of stock items
- Inventory value
Visual Analytics
Sales Charts
- Daily sales (last 7 days)
- Weekly comparison (this week vs last week)
- Monthly sales (last 6 months)
Quick Actions
From the dashboard, you can quickly:
- Record a new sale
- Add products
- View low stock items
- Access reports
- Manage staff
Dashboard Components
Sales Summary Card
Displays key sales metrics with visual charts showing daily, weekly, and monthly trends.
Low Stock Alerts
Real-time notifications for products below threshold with quick access to inventory management.
Recent Sales
List of recent transactions:
- Transaction ID
- Total amount
- Cashier name
- Date
- Status
Role-Based Views
Admin View
Full access to all features:
- Complete sales analytics
- Staff management
- System settings
- Backup management
- User administration
Manager View
Store management focus:
- Sales reports
- Inventory oversight
- Product management
Cashier View
Simplified operational view:
- Today's sales summary
- Quick sale recording
- Product lookup
- Basic inventory check
Analytics & Reports
Sales Analytics
Daily Reports
- Daily sales trends over last 7 days
- Revenue per day
Weekly Reports
- Week-over-week comparison
- Sales by day of week
Monthly Reports
- Monthly sales over last 6 months
- Total sales per month
Inventory Analytics
- Total inventory value
- Low stock alerts
- Out of stock tracking
AI-Powered Insights
The dashboard integrates AI features for:
- Sales predictions
- Inventory recommendations
- Trend identification
- Anomaly detection
Learn more about AI Features →
Export Options
Export sales data to CSV format for further analysis.
Best Practices
Daily Routine
- Check low stock alerts
- Review yesterday's sales
- Monitor today's performance
- Address any issues
Weekly Review
- Analyze sales trends
- Review inventory levels
- Plan restocking
Monthly Analysis
- Generate monthly reports
- Compare with previous months
- Identify growth opportunities
- Adjust strategies
Troubleshooting
Dashboard Not Loading
- Check internet connection
- Clear browser cache
- Verify user permissions
- Check server status
Data Not Updating
- Refresh the page
- Check database connection
- Verify background jobs
- Review error logs
Slow Performance
- Clear old data
- Optimize database
- Check server resources
- Reduce displayed metrics
Related Features
- Sales Recording - Record and manage sales
- Inventory Management - Track stock levels
- Staff Management - Manage team members
- AI Features - AI-powered insights
Technical Details
The dashboard uses:
- TanStack Query for data fetching
- Recharts for visualizations
- Real-time updates via polling
- Optimistic UI for instant feedback